You run a program you are working on, and it crashes, or it raises an exception. What do you do?
The most widespread reaction is to add a few print instructions here and there and re-run the program. These print instructions can print some variables for you to see what their value was at a given moment, or they can just print some text for you to see that “the program was at this line of code at this time”, so that you understand the steps the program went through.
There is no shame in doing print-based debugging. Everyone does it. Sometimes it is the only option you have, for instance if the program can only run in a specific environment you have a limited control on. But other debugging tools exist, and learning how to use them can make your life as a programmer much easier.
Breakpoints
Breakpoints allow you to pause the execution of a program and inspect its current state, including the values of variables as well as the call stack. In Python the breakpoint() built-in function was introduced in version 3.7 and does exactly that: it pauses the program and start a tool called the Python debugger that let you not only inspect the current state of the program, but also modify the state as well as control the execution of the program: running it instruction-by-instruction, skipping an instruction, or even jumping to another line of code (see all debugger commands here). For Python earlier that 3.7, you can just insert import pdb; pdb.set_trace(): it has the same effect as calling breakpoint() in later versions of Python, it is simply not as nice to read and write.
Using breakpoints require to learn how to use a debugger, but even with very basic experience with debuggers you can already get a lot of value from using breakpoints. With breakpoints you don’t have to know in advance what to print: You can figure it out when you will be at the breakpoint. You can print something only to realize that you also need to print something else, without having to re-run your program again.
Breakpoints are not just a faster way to do what you can already do with print statements: some things that are doable using breakpoints are impossible to do by just re-running your program. One example is fixing values: imagine you have a variable which value seems wrong; you would like to confirm that “fixing this variable fixes the program”. You are able to tell what should be the correct value if you see the variable, but the value of the variable changes at each execution, so at each new run of the program you have to see the value first, and only then can you tell how to fix it. This is an easy thing to do with breakpoints: you set a breakpoint, you print the variable, change it’s value, and tell the debugger to continue. If you only use print statements however it is close to impossible.
Post-Mortem Debugging
Breakpoints are great, but with breakpoints you still have to re-run your code at least once: you run it, it crashes, and then you add some breakpoint() instructions and re-run it. What tells you it’s going to behave the same way on the second run? What if it was a bug that only appears rarely?
Setting your breakpoints first and then running your code has some other drawbacks: imagine you set a breakpoint in a for loop that will be run a thousand times before the bug appears: your debugger will pause the program a thousand times and you will have to tell it to continue a thousand times. Worse, how can you tell, every time the program stops, if this iteration is the one where the bug will appear or if you should tell the debugger to continue? You’ll probably only know after the program has crashed, and then your breakpoints were set for nothing.
What you would like to do is running you program and, if it crashed, going back in time to understand why it crashed. This is called post-mortem debugging. In order to perform post-mortem debugging using the Python debugger, you simply have to run your Python program with python -m pdb prepended:
python -m pdb my_script.py
# also works when running a module as a script:
python -m pdb -m my_module
When invoking pdb like this, the Python debugger will start at the very first instruction and stop. You can modify a few things if you want, and when you are ready to run the program you can simply give the continue command to the debugger. You can set breakpoints if you want, but you don’t have to. From pdb’s documentation:
When invoked as a script, pdb will automatically enter post-mortem debugging if the program being debugged exits abnormally.
Let’s demonstrate this on a toy module my_module containing only a __main__.py file:
def main():
    x = 1234
    y = compute_y(x)
    print(f"result with {x=}: {y=}")

def compute_y(x):
    result = x
    for i in range(10):
        divisor = 5-i
        result += x / divisor

    return result

if __name__ == '__main__':
    main()
This code will crash, but instead of having to guess where and why the exception appears, let’s just run it in pdb:
$ python -m pdb -m my_module
> /home/cedricvr/Dropbox/writing/blog/code/post-mortem-python/my_module/__main__.py(1)<module>()
-> def main():
(Pdb) continue
Traceback (most recent call last):
  File "/usr/lib/python3.10/pdb.py", line 1724, in main
    pdb._runmodule(mainpyfile)
  File "/usr/lib/python3.10/pdb.py", line 1560, in _runmodule
    self.run(code)
  File "/usr/lib/python3.10/bdb.py", line 597, in run
    exec(cmd, globals, locals)
  File "/home/cedricvr/Dropbox/writing/blog/code/post-mortem-python/my_module/__main__.py", line 15, in <module>
    main()
  File "/home/cedricvr/Dropbox/writing/blog/code/post-mortem-python/my_module/__main__.py", line 3, in main
    y = compute_y(x)
  File "/home/cedricvr/Dropbox/writing/blog/code/post-mortem-python/my_module/__main__.py", line 10, in compute_y
    result += x / divisor
ZeroDivisionError: division by zero
Uncaught exception. Entering post mortem debugging
Running 'cont' or 'step' will restart the program
> /home/cedricvr/Dropbox/writing/blog/code/post-mortem-python/my_module/__main__.py(10)compute_y()
-> result += x / divisor
(Pdb) p (x, divisor)
(1234, 0)
(Pdb) list
  5
  6  	def compute_y(x):
  7  	    result = x
  8  	    for i in range(10):
  9  	        divisor = 5-i
10  ->	        result += x / divisor
11
12  	    return result
13
14  	if __name__ == '__main__':
15  	    main()
(Pdb) p i
5
(Pdb)
Here we start the module through the debugger, we call continue to execute the program, and we see that the debugger enters post-mortem mode when the program crashes. We then use the debugger to print the variables that were used in the code line that raised an exception (p (x, divisor)), we list the code lines around this code line (list), and we print another interesting variable (p i). Now we know why the program crashed: in the for loop, when i reached value 5, the value of divisor became zero, causing a division by zero.
Debugging in an Interactive Session
One of the main advantages of interpreted languages like Python is the interactive shell, where you can experiment, see your mistake or figure out what the next step should be and continue without having to re-compile and re-run your entire program every time like with compiled languages. Now when you have an exception in an interactive session, what do you do? You would like to debug the code that just crashed in post-mortem mode but, obviously, you cannot call python -m pdb in the middle of an interactive session.
In order to enter post-mortem debugging in an interactive session, you can simply run pdb.pm(). Note that this will require to have run import pdb beforehand. Calling pdb.pm() will cause the Python debugger to enter post-mortem debugging on the last exception that was raised (and wasn’t caught).
$ python
Python 3.10.4 (main, Jun 29 2022, 12:14:53) [GCC 11.2.0] on linux
Type "help", "copyright", "credits" or "license" for more information.
>>> from my_module.__main__ import main
>>> main()
Traceback (most recent call last):
  File "<stdin>", line 1, in <module>
  File "/home/cedricvr/Dropbox/writing/blog/code/post-mortem-python/my_module/__main__.py", line 3, in main
    y = compute_y(x)
  File "/home/cedricvr/Dropbox/writing/blog/code/post-mortem-python/my_module/__main__.py", line 10, in compute_y
    result += x / divisor
ZeroDivisionError: division by zero
>>> import pdb
>>> pdb.pm()
> /home/cedricvr/Dropbox/writing/blog/code/post-mortem-python/my_module/__main__.py(10)compute_y()
-> result += x / divisor
(Pdb) list
  5
  6  	def compute_y(x):
  7  	    result = x
  8  	    for i in range(10):
  9  	        divisor = 5-i
10  ->	        result += x / divisor
11
12  	    return result
13
14  	if __name__ == '__main__':
15  	    main()
(Pdb)
Finally, if you don’t find the standard Python debugger very readable, you can always use the one provided by the IPython shell. IPython is an alternative to the standard Python shell that is much nicer to look at and has a few extra features. IPython has something called “magic commands” and one of them, the %debug magic command, is the equivalent of calling import pdb; pdb.pm() except that it’s much easier to type and that you end in ipdb, the IPython debugger, a nicer-looking version of the standard Python debugger.
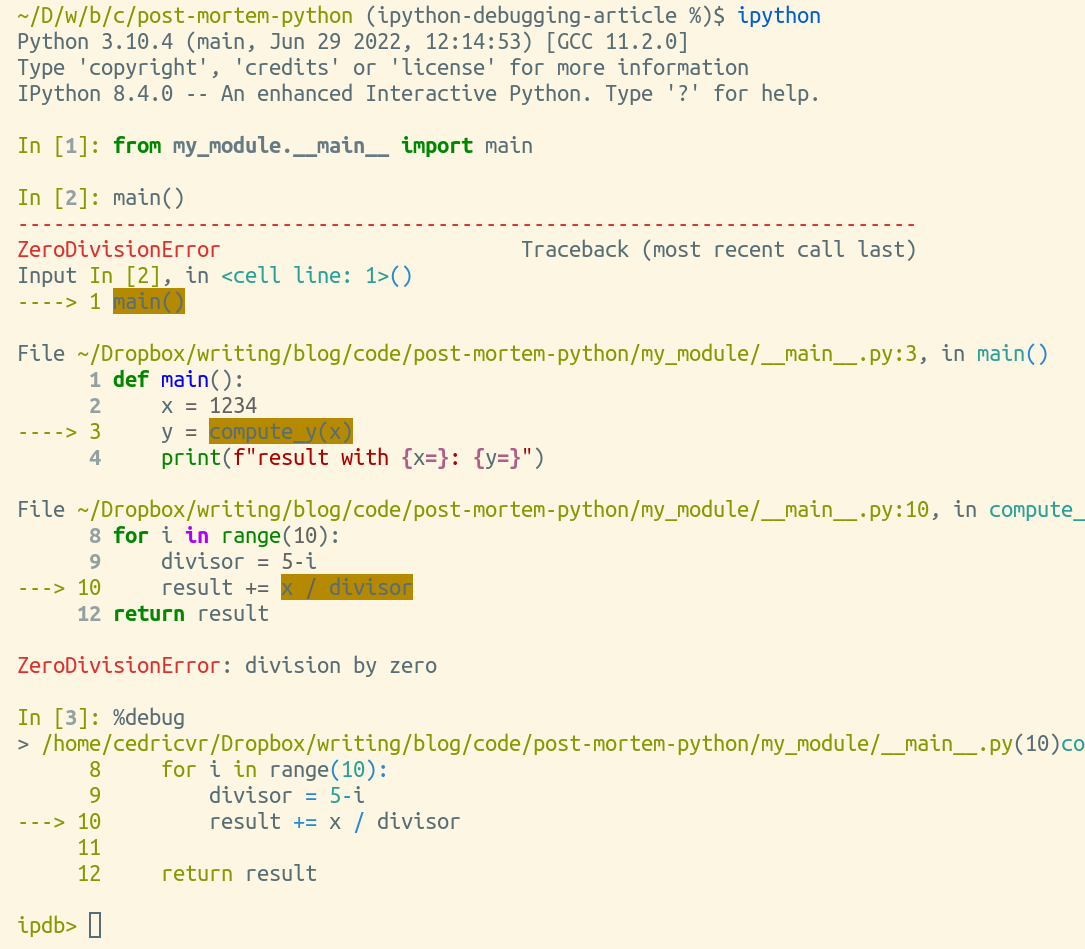
screenshot of the previous example in IPython
I actually use ipython more often than python to use Python in interactive mode, because of the %debug magic command, but also because of the %save magic command. ipython is also so much more readable than bare python.
If you really like the IPython debugger and you want to use it to debug not just interactive sessions but also programs, you can install it as a separate package with pip install ipdb and then you can just call ipdb instead of pdb:
python -m ipdb my_script.py